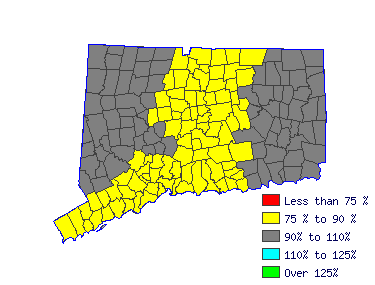
 |
| Mean Wage History |
| Year | This
Occupation | Compared to
Occupational Group | Difference |
| Current | $36.93 | | $31.07 |
| $5.86 |
| 2015 | $35.65 | +3.6% | $29.99 |
+3.6% | $5.66 |
| 2014 | $34.81 | +2.4% | $29.29 |
+2.4% | $5.52 |
| 2013 | $33.97 | +2.5% | $28.58 |
+2.5% | $5.39 |
| 2012 | $33.41 | +1.7% | $28.11 |
+1.7% | $5.30 |
| 2011 | $32.89 | +1.6% | $27.67 |
+1.6% | $5.22 |
| 2010 | $32.19 | +2.2% | $27.09 |
+2.2% | $5.11 |
| 2009 | $31.96 | +.7% | $26.89 |
+.7% | $5.07 |
| 2008 | $30.97 | +3.2% | $26.06 |
+3.2% | $4.91 |
| 2007 | $29.96 | +3.4% | $25.20 |
+3.4% | $4.75 |
| Year | This
Occupation | Compared to
All Occupations | Difference |
| Current | $36.93 | | $19.32 |
| $17.61 |
| 2015 | $35.65 | +3.6% | $18.78 |
+2.9% | $16.87 |
| 2014 | $34.81 | +2.4% | $18.38 |
+2.2% | $16.43 |
| 2013 | $33.97 | +2.5% | $18.01 |
+2.1% | $15.96 |
| 2012 | $33.41 | +1.7% | $17.70 |
+1.7% | $15.72 |
| 2011 | $32.89 | +1.6% | $17.42 |
+1.6% | $15.47 |
| 2010 | $32.19 | +2.2% | $17.13 |
+1.7% | $15.07 |
| 2009 | $31.96 | +.7% | $16.90 |
+1.4% | $15.07 |
| 2008 | $30.97 | +3.2% | $16.46 |
+2.6% | $14.51 |
| 2007 | $29.96 | +3.4% | $15.94 |
+3.3% | $14.02 |
 |
|
| Reference Date: 1st Quarter 2016 |


